Running Style - Position Report Information
The best way to WIN MONEY at the RACES!
- What is Running Style-Position all about?
- It's about winning and knowing why you won.
- It's about predicting not only who will win, but how they will win.
- It's about feeling confident enough with your selections to increase your wagering unit.
- It's about playing more than one track at a time without wasting hours wading through meaningless information.
- Why use RsPos TM products?
- They help you see the race in your head quickly.
- They give you all the information you need, and only the information you need.
- They give you the best Speed Ratings, Pace Ratings, and the best Projected Speed Ratings available.
- They are clear, concise, informative, and unique!
We offer seven different handicapping reports. A short description of each report is shown in the list below. To view a sample of a report, just choose the title of the report.
- SUMMARY REPORT
- The most widely used report that we produce. This is the most important tool we offer to horseplayers. Usually one page per race, it includes only the information you need to form your opinion about the race. Plus, it is color-coded for easy viewing!
- PAST PERFORMANCE REPORT
- Past performances for every horse with HDW's unique Pace and Speed Ratings. Also includes part of the Summary Sheet for each race.
- COMPREHENSIVE TRAINER/JOCKEY/PEDIGREE STATISTICS
- Statistics pertinent to today's race. Trainer stats, jockey stats, trainer-jockey combination stats, sire, damsire and dam stats.
- ENCAPSULATED PAST PERFORMANCES
- Usually one page per race, gives you a quick summary of each horse's last 10 races including Speed Ratings.
- SUMMARY RESULTS - QUICK RESULTS - CHARTS
- Summary Results lets you view the Summary Sheet, with scratches, and see which Running Style- Position won each race.
About RS-Pos(TM) Running Style-Position Report
What is RsPos TM (Running Style-Position)?
Running style-position is a complete methodology that is designed to help us understand how a race will be run. By assigning a descriptive label to each horse we can highlight similarities and differences between horses and between races. This allows us to view the handicapping process from a new and different perspective.
This method involves two major components:
1. Determining projected "Rs" (Running Style)
2. Determining projected "Pos" (Position)
The projected "Rs" is determined prior to the race and attempts to project how the horse can win the race, while the actual running style, after the fact, indicates how the horse actually ran the race. It is important to understand this distinction between what was projected and what happened. Every paceline in a horse's past performances has a projected "Rs" and an actual running style.
We have defined 7 major categories of running styles. They include: "E", "EP", "P", "PS", "S", "SS", and "U". The "rule-of-thumb" definitions for running styles are as follows:
| Running Style | Description |
|---|---|
| E - Early | A win where the horse goes wire to wire |
| EP - Early Presser | A win where the horse is within 1 length of the leader at the 1/4 mile call |
| P - Presser | A win where the horse is within 1 length of the leader at the 1/2 mile call |
| PS - Presser Sustained | A win where the horse is within 1 length of the leader at the stretch call |
| S - Sustained | A win where the horse does not qualify for any of the above but is never more than 7 lengths off the pace or positioned farther back than seventh |
| SS - Slow Sustained | A win where the horse does not qualify for any of the above, in other words, a deep closer |
| U - Unknown (or Ugly) | The horse has not demonstrated its' running style yet |
Every horse's projected "Rs" is defined by the way they win races, and we consider the last three wins. For example, if a horse has won only as an "E" then he is projected as an "E", if he has won as an "E" and an "EP" then he is projeted as an "EP", if he has won as an "E", "EP", and "P" then he is projected as a "P". In each case we use the running style furthest off the pace when the horse has won with more than one running style. There are sub categories and subtleties (capital E versus small "e", versus! etc.) that we have discovered that we cannot explain here. While the actual algorithm we use to determine running style is complicated and proprietary, all you need to do is understand these definitions of running styles and a picture of how the race will be run will begin to evolve.
A typical "E" horse is going to try to win wire to wire, where a typical "PS" horse will not get involved in the early going and will not put any pressure on the early pace. In fact, to run his best race, he should not get involved in the race until the stretch. An "SS" horse will be at the back of the pack, won't put any pressure on any part of the race, and will win probably on the last stride (if he wins at all). "SS" horse typically do not win their fair share of races.
The very tight definitions described above give us an opportunity to predict a horse's chance of winning by only knowing his projected "RS." For example, an "EP" horse that is slower than an "E" horse in the race has a reduced chance of running his best race. A "PS" horse whose stretch pace ratings are inferior to all other horses in the race can not run his best race. A "P" horse that has never run a half-mile close to others in the race has a small chance of running his best race. With a little bit of experience you can scan our Rs-Pos TM reports and immediately see which horses have a good chance of winning, and which have little or no chance of winning.
The "Pos" part of RsPos TM is determined by how fast each horse can run. If all of the horses in the race broke out of the gate and ran as fast as they possibly could, what would their positions be after 1/4 mile? Wthout getting into a discussion about all of the methods we have tested to determine this, we continue to use the best 1/4 mile (first quarter mile out of the gate) that a horse has actually run in its last 10 races. The correlation between this ranking and finish position is near perfect.
We use the best 1/4 time (B1/4) for each horse in the last 10 races and rank each horse in today's race. The horse that ranks 1 will win more races than the horse that ranks 2, who will win more than the horse that ranks 3, who will win more than the horse that ranks 4, etc. The horse that ranks 7th will most likely be 7th at the first call and will most likely finish 7th. This fact gives us a powerful tool to use in our handicapping.
Another fact to keep in mind - this is raw speed to the first quarter mile - it is not adjusted in any manner. Horses that can run fast have demonstrated that they can run fast! We have found that it is best to use this number without adjustment. We know that when horses move from a very fast track to a very slow track, they slow down, they don't all slow down the same amount. Conversely, to assume that horses speed up when moving from a slow track to a fast track is incorrect. Not all of them do! Our studies show that "E" horses are more affected than "S" horses when moving from a slow surface to a fast surface, but it is very difficult to say, accurately, by how much.
Combining the two, running style and position, we have a descriptive label that uniquely identifies each horse in the race: E1, P4, PS5, S7, EP2, SS13. Once these labels are applied, the understanding of each race is greatly improved, and the reasons why certain horses win or lose become much more evident. The number of different race scenarios is large - but improving your understanding of the race by using RsPos TM will give you a significant edge. While impossible to discuss each one of these different scenarios, we will illustrate a few of the more common ones.
For example, a lone "E1" with an inside post will get the lead about 60% of the time and will win about 50% of the time that he gets the lead. If he has been in races in his recent past where he has been an E3 or E5 or not alone (not the only E), he could possibly go wire to wire today at a big price. It happens all the time!
"P" horses tend to place more than they show, and very often a morning line favorite P5 or P6 will be the place horse and not the win horse. A P1 will run his best race when he is outside, ridden by a jockey that likes to track, and is behind an E1 and E2.
An "S7" can't win on his own - the horses in front of him have to go too fast and set the race up for him, and the S7 must have final times far superior to an EP1 in the same races if he is expected to beat him.
"S" horses show more than they win and are key to playing trifectas. An E7 is more likely to run last than first, and at times are favored to win without a prayer of doing so.
After using RsPos TM you begin to notice that certain jockeys have strong preference for a particular position that they would like to obtain, and will do fine if the horse happens to be capable of getting to that position, but fail otherwise. For example, some jockeys prefer to lay second, where others are more likely to take a stronger hold. Some are almost sure to gun for the lead out of the gate. However, the horse will finish better when the jockey matches the horse's position or takes back from that position. Horses perform worse when the jockey moves them forward of their preferred position.
For example, a P4 will do much better if he runs from the 4th position rather than from 1st. An EP6 usually doesn't fit the race since he doesn't have the early speed to get the position an EP needs to run his best race. "E" horses typically run 1st and 3rd, "P" horses run 2nd, "S" horses run 3rd more than they win, etc. Horses that are 1st, 2nd, 3rd at the 1/4 mile win about 60% of the races, and the running style-position methodology draws your attention to these horses!
We hope this has piqued your interest and given you an overview of how RsPos TM can be used to increase your chances of beating this tough game. All of us at HDW are available to answer questions and help you along in using these powerful tools. Please visit the forum for more information.
History of RsPos (TM)
In The Beginning...
Jim Cramer at HDW has been working on thoroughbred handicapping databases for the past 14 years, but his method of "Running Style-Position" (RsPos TM) handicapping has been with him since 1979, when he began using it at Calder Race Course in Florida, where he owned and trained race horses.
Back then, Jim's techniques were a little rough around the edges. For example, his labeling of each horse's running style was not as elegant as the one you're about to be exposed to. Twenty four years ago, he called E (early horses) "WTW" (wire to wire) and S (sustained) horses "CFB" (come from behind) with deep closers called "CFFB" (come from far behind). These labels took care of the "Rs" - running style.
In 1979, Cramer had yet to disover the power of projecting each horse's position. The second part, "Pos" (position) was ignored. While making wagers based solely on the "Rs" was profitable, Cramer knew it could be improved. Twelve years later, Jim found the missing ingredient was the second part - Position.
Intuitively, Cramer knew that certain distances favored certain running styles, and that certain jockeys "fit" certain horses. It was imperative for him to spot his own horses where the profile of the racetrack said they could win, and then link the horse with a rider that complemented the horse's style.
All these things were second nature to Jim. He had an uncanny feel for them. What he did not have, however, was cold, hard data that proved their effectiveness beyond the shadow of a doubt.
Which brings us to 2005. Now, with some help from other handicapping experts and exhaustive research of the databases, Jim has both refined his techniques and compiled the statistics that make the RsPos TM data the newest, if not the most powerful approach to pace handicapping available. You are about to be exposed to all aspects of this approach. We are confident it will improve your game and add a valuable dimension to your handicapping.
The Importance of Early Speed
- There were 60,881 throughbred horse races run in North America in the last 365 days.
- The leader at the first quarter-mile of these races (both sprints and routes) won 29.3% of the time.
- The horse in second place at the first quarter mile of these races won 17.5% of the time.
- The horse in third place at the first quarter mile of thse races won 13.8% of the time.
- These data provide a perfect, positive correlation: the closer a horse is to the lead at the first quarter mile of a race, the better his chances of winning that race.
- If you had made a flat bet on each of the leaders at the first quarter mile of all races, your profit rate would hve been 64.9%!! This has been consistent, year in and year out, for well over 10 years (since we have been tracking it).
- As a group, horses that are within the first three positions at the first quarter mile of their races win a combined 60.2% of all races.
- These data suggest that it would be wise to focus on horses that project to run first, second, or third at the first quarter mile of today's race.
- These data also suggest that it's usually unwise to bet on horse that project to be fourth or worse at the first quarter mile of the race unless the race shape predicts a come-from-behinder has a better than usual chance of winning.
Knowing Your Track
No two tracks behave alike. While most tracks generally favor horses that have good early speed, there are certain distances at that track that can discriminate against the frontrunner.
For example, at most major tracks, the seven furlong distance will yield a lower win percentage for the horse on the lead than the other sprint distances do. Many times, the five and a half furlong distance behaves in the same manner: front runners don't win as often.
Jim says the reason for this is that seven furlong races are usually made up of a lot of six furlong sprinter who go too fast too early in the seven furlong race. Hence things set up for a non front runner. He calls the seven furlong race "the toughest race there is" for the racehorse, and "the most difficult to handicap" for the horseplayer.
In five and a half furlong races, jockeys tend to send their horses more than usual, given the short distance. Again, the pace in these races is usually too fast for the front runner to survive.
Given the fact that horses on the lead at the first quarter mile of all races win 28.9% of the time, it's easy to make some general conclusions about the relative tendencies of any track to favor front runners: tracks where the front runners win more than 28.9% of the races can be classified as above average when it comes to favoring early speed; conversely, tracks where front runners win less than this percentage can be classified as below average for front runners. Some examples:
- Above average: Charles Town (29%), Aqueduct (33%), Golden Gate Fields (32%)
- Average: Santa Anita (29%), River Downs (29%), Hawthorne (28%)
- Below average: Meadowlands (22%), Fairgrounds (20%), Keeneland (18%)
Knowing how front runners fare right now at the tracks you play is of the utmost importance.
Jockey Profiles
Like horses, jockeys have preferred running styles. Often, the public perception of a jockey's favorite style is nothing more than that - a perception. Cramer's data is frequently revealing and sometimes shocking.
Jim's data for jockeys nationwide focuses on each jockey's percentage of wins on the lead. Jim cites the example of Florida and Chicago based jockey Earlie Fires, whose victories occur on the lead 52% of the time.
In sharp contrast to Fires is Julie Krone, whose wins on the lead account for a shockingly small six percent of her total wins.
Jim then focuses on where each jockey on a circuit (the Southern California circuit) tends to position his mounts at the first quarter mile. These data shatter a few long standing public perceptions.
For example, Eddie Delahoussaye is considered a patient, take-back style of jockey. Jim's data show that Eddie D. goes to the lead just as often as he takes back to fifth place in a race. On the other hand, Martin Pedroza is thought of as a hustling rider who sends all his mounts to the lead. He may try to do that, but Jim's data shows he's not that successful at it: his mounts are more likely to be in fourth position at the first quarter mile than they are to be on the lead.
Next, we measure where the same jockeys position their mounts when they win. Again, the public's perception of a jockey is often misguided. For example, Eddie Delahoussaye has a reputation as being "king of the closers." A look at the data shows Delahoussaye does far better taking horses wire to wire. Conversely, Patrick Valenzuela is known as a superior front running rider. But the data show that among the top 10 riders in Southern California, Valenzuela has the fewest number of front running victories.
Only the data can precisely label a jockey's preferred running style. Public perception is often wrong.
Jim says these jockey styles can have a big impact on the shape of today's race. Jockeys tend to place their horses the way they (the jockeys) like to ride. For example, Kent Desormeaux puts more horses in the third spot early than any other spot. Desormeaux's image as a take back jockey is warranted. Patrick Valenzuela puts more of his mounts on the lead than in any other position. In any jockey colony, the members eventually sort out their various positions.
The jockey's preferred running style should match that of the horse. If not, all prime bets are off.
Running Styles - Defined
The first of syllable of Jim's RsPos TM is for "Running Style." When a horse wins a race, it usually comes as the result of being able to run to its preferred pace style or running style. Jim's first challenge is to identify the running style of each horse. The possible designations are as follows:
- E (Early)
- EP (Early Presser)
- P (Presser)
- PS (Presser Sustained)
- S (Sustained)
- SS (Super Sustained)
- U (Undefined or Ugly)
To identify the horse's preferred running style, look only at its previous wins. Each win will be labeled with one of the running styles. The running styles are defined as follows:
- E (Early): A win in wire to wire fashion ONLY. The horse was on the lead the whole way and won. (The exception is horses wearing blinkers. Blinkered horses can be within a quarter length of the lead at the first quarter mile and qualify for an E win, since this kind of horse might not know there's another horse next to him.)
- EP (Early Presser): A win in which the horse did not lead at the first quarter mile, but was within one length of the lead at that point. Jim says this horse "overlaps" the leader early. It's vital to look at the first quarter mile of the horse's win, not the first call. (In sprints, the first call and the first quarter mile are the same; in routes the first quarter mile occurs before the first call in route past performances.) Whenever possible, use the first quarter mile. This sets the RsPos TM method apart.
- P (Presser): A win in which the horse was not within one length of the lead at the first quarter mile, but was within a length of the lead at the half mile.
- PS (Presser Sustained): A win in which the horse was not within one length of the lead at either the first quarter mile or the first half mile, but was within one length of the lead at the stretch call.
- S (Sustained): A win in which the horse was not within one length of the lead at the first quarter mile, the first half mile, or the stretch call.
Based on these definitions, and with some minor exceptions, we have developed a methodical approach to labeling the running style of all non-E wins.
- Start with the first quarter mile. If the horse is within one length at that point, it's an EP win.
- If not, then move on to the first half mile. If the horse is within one length at that point, it's a P win.
- If not, then move on to the stretch call. If the horse is within one length at that point, it's an SP win.
- If not, then the win is an S win.
By proceeding in this linear manner, each win's running style becomes a snap to identify.
The next step is to label the horses running style. Many horses will show wins only in a certain manner, most likely E or S. Horses that show a variety of running styles in their victories must be handled differently.
In the case of multiple running styles, Jim says to take the horse's "farthest back running style," indicating that they horse may run as that running style or a more forward running style. For example, if a horse shows a victory as an E and an EP, label the horse an EP - it is the farthest back running style. If a horse shows victories as a P and S, label the horse an S.
At this point, after identifying a horse's running style and the jockey's riding style, we then try to make the most fundamental elimination - when the horse's running style and the jockey's running style clash. For example, when a P horse switches from a "take back" or presser jockey to a "send" or early jockey, the P horse will find himself on the lead, and probably won't cooperate. Running a horse forward of his preferred running style usually results in a poor performance.
Combining Running Style With Position
Once we have labeled each horse with a running style, we then rank each horse on the basis of where that horse figures to be at the first quarter mile of today's race. This is only a rough guide - you really have to look at the shape of the reace, post position, and jockey to get an accurate guesstimate of who will be where at the first quarter mile.
For example, an E1 is an Early horse who projects to be on the lead at the first quarter mile. An EP3 is an Early-Presser horse who projects to be third at the first quarter mile. An S7 is a sustained horse who projects to be seventh at the first quarter mile. And so on.
We arrive at the positions as follows:
- Adjust all of the horse's first quarter mile times for beaten lengths.
- Take the fastest first quarter mile.
- Rank the horses based on their first quarter mile times. Note each horse's rank alongside its running style.
The challenge and fun come from analyzing and interpreting these designations in order to eventually form a basis for predicting how each race will unfold.
Early Horses - A List of Their Characteristics
Given the fact that horses on the lead at the first quarter-mile win more than 29% of all races, it's easy to see why we are so fond of Early horses. Here are some of their unique characteristics:
- They win races.
- They are the most inconsistent, most erratic horses. When they run last, it's not because they're in bad form - it's because they don't get the lead in that race. If an E horse figures to be an E6 or E7 in today's race, and he's in an outside post, he's definitely not in a position to run his best race. BUT - don't throw him out. He may have a significant impact on how the race is run! That's why you won't hear many RsPos TM users talking about 'contenders' and 'noncontenders.'
- They wear blinkers and they try hard (at least to get to the lead) all the time. When they get loose, then can run phenomenal races...and usually at BIG prices.
- They quit. They run last a lot. They run third a lot. Our study of 5,000 E horses showed that their records typically look like 25 10-0-10 or 72 26-0-10. E horses run third a lot, but don't put them on the bottom of an exacta!
- They are almost always the "first horse out" (dropping out of the race) if they can't make the lead.
- They need a good "send" jockey, and they need to be inside, where they'll get the easiest path into the turn. To clear another E horse inside, the outside E generally needs to be about two lengths superior at the first quarter-mile to get the lead. At times, an E5 on the rail can keep position with an E1 marooned on the far outside.
Running Style Position and Race Shapes
We have listed some scenarios in which certain combinations of running style and position (for example, EP1) tend to do their best, as well as combinations that virtually demand elimination:
An E1 will do its best when it:
- Owns the first quarter mile by a length or two.
- Is drawn on the inside.
- Has a jockey that will take a good hold and not let them run off 10 lengths ahead in the first half mile.
- Own the half mile by a length or two and project to run the best final time.
An E1 and an E2 will duel if the E2 is on the inside. In these instances, it is best to be the P3 if there is one in the race.
E2's can win, but they need to be alone at the half mile. E2's do have a "1" horse to contend with, and they can most successfully contend if that "1" horse is a P1 whose half mile time is slower than the E2's. In other words, if the E2 owns the half mile, he can be bet over the P1 with a lesser half mile. E3's (and greater) will have a hard time winning. Like E2's, they have to be alone and must own the first half mile - a very tough assignment because a P1 or P2 can own the half mile. The E3 needs alot of luck.
If the race consists of all E horses (every horse in the field shows only wire to wire wins), the E1 will win as the "speed of the speed."
However, sprint E horses stretching out will probably go too fast early to win the route, especially if they have an E jockey.
In all situations, E horses should be played sparingly on the bottom of exactas, since this type of horse does not place often enough. However, they do stop and finish third.
EP's are very reliable, and one of our favorite bets is the EP1 who owns the race. In other words, the EP1 who has the fastest quarter-mile, half-mile, and final time. By definition of their position (1), EP1's can run faster than any other horse to the first quarter mile, but by definition of their running style (EP overlapping the leaders), they won't be on the lead. They'll be just off the lead, tracking it. And they'll be running well within their abilities.
The EP1 is even stronger when tracking an E2 or an E3. The EP1 can pass them whenever he wants. The E2 and E3 have shown no ability to pass horses in their victories. The strongest EP1 is the one who has a two length or more advantage at the first quarter mile.
By definition, the EP! (the "!" is for exclusive) can win only when overlapping the pace. So the EP!6 is probably a bad bet, since he won't be overlapping the leaders at the first quarter mile. Look for improvement from an EP if in this race he is an EP1 or EP2 and in his past races he was an EP4 or EP5 and couldn't get in the race because of his mid pack position.
The EP who projects to be an EP5 through 8 today might have best final times or speed figures, but won't get a slow enough first quarter mile to overlap the leaders today.
EP's are excellent candidates in exacta or trifecta boxes. Our studies of tens of thousands of EP horses show that they win, place and show with equal frequency. However, the very best EP's win and place with equal frequency but show a lot less (for example, their lifetime records might look like this: 62 24-23-9).
The P1 horse needs to sit behind two or more E horses, and needs a jockey who can put it right behind the E horses, not too far back.
In a field having an E2, E3, E4, and E5, the P1 is in a great spot. He can track the dueling E's, save energy because he's not going to his fastest first quarter mile like the E's are, then run by the E horses any time he wants, even to the first quarter (which he probably will not do, since he's a P).
The P3 will not win if a P1 and P2 project to be ahead of him.
P7-14 horses are best eliminated. They probably will not get involved in the race. They may try to move up to second, third, or fourth at the half mile, but will usually fade late. They need to be within a length at the half, but probably won't make it.
In the race with a stack of P horses the P1 should win.
However, P horses who project to get involved in a duel to the first quarter probably will not have enough energy left at the half, where they will need to be within a length of the lead, as shown by their previous victories.
P horses run second a lot. Their lifetime records show it.
PS horses win when they have a stack of E horses in front of them. The PS must be close at the half mile, while laying fifth, sixth, or seventh. They need a collapse of the leaders. For this reason, they win a lot of seven furlong races in which the E horses (usually six furlong sprinters) go too fast too early. The PS horse also needs a patient jockey, such as Kent Desormeaux or some other take back rider. Early jockeys generally can't win on the PS horse.
Unlike P horses, S horses' lifetime records are more even in the win and place holes, but tend to jump up in the show spot. S horses can win, and are the most consistent horse in racing. Their final fractions tend to stay the same from race to race. To win, the S horse needs losers in two places: E and P. The S finds these losers when there are several E horse pulled too far forward, and as a result, several P horses are pulled too far forward. These E horses and P horses will get burned up, while the S horses will stay even farther off the pace.
The S7 is the best of the S horses. The fact that six horses will be in front of him early says there will be alot of speed today. S horses run third alot. Jim says "the 'S' in Sustained stands for show." The lifetime records of S horses look like 7-8-26; 4-9-17;5-11-17. Our study of 5,659 horses with more places higher than wins and twice as many shows as wins, shows that their preferred running style is S. S horses run up to get third.
In general, the following projected pace scenarios favor certain types of horses:
| PACE | BENEFITS |
|---|---|
| Very Slow | E horses on the lead |
| Slow | E horses on the lead |
| Normal | E horses on the lead |
| Fast | P4 - 6 can win |
| Very Fast | S7 - 9 can win |
The probable pace can be predicted by noting the running styles of the horses in today's race.
For example, if today's race is made up of an E1, E2, E3, EP4, EP5, E6, and an S7, the race will probably have a very fast pace.
In the case of a race made up of a P1, P2, P3, and PS4, for another example, a very slow pace will probably develop, since there are no E horses in the mix. The top three won't change positions during the running of the race.
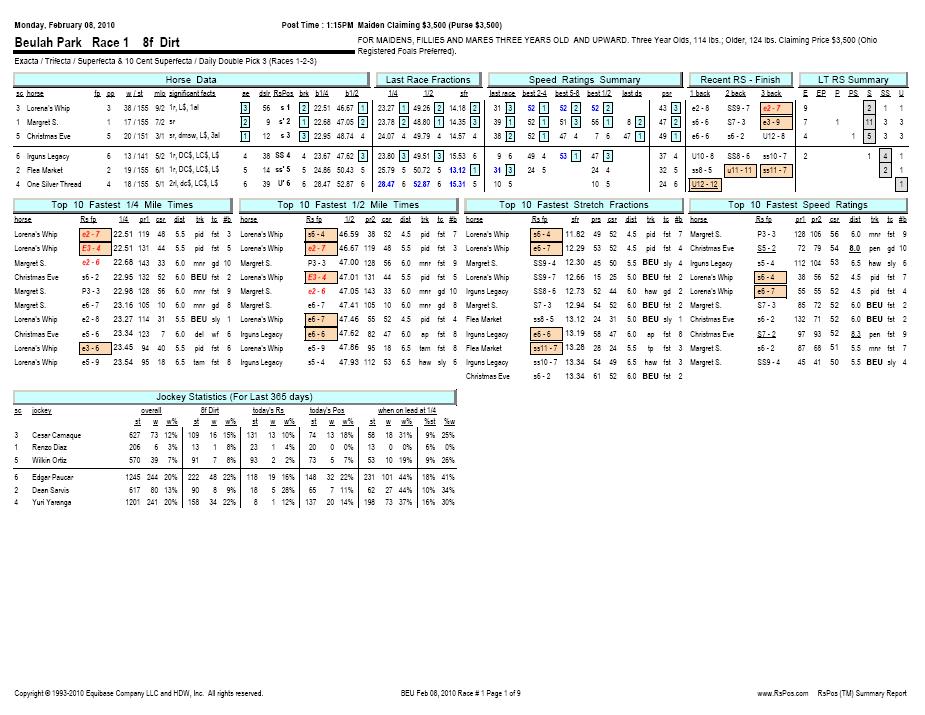
How to Read - RsPos (TM) Summary Report
The RsPos TM Summary Sheet is by far the most widely used report of all the RsPos TM reports. Internally at HDW it is the sole handicapping tool used on a day to day basis. This report was designed to give you everything a handicapper needs to make a choice without cluttering the page with irrelevant information. It allows you to formulate opinions about a race quickly so that you can play as many races in a day as you like.
Below is a sample of the Summary Sheet. We will describe in detail all the different parts of this valuable report. You will soon see that there is a wealth of information available and it all fits on one page per race!
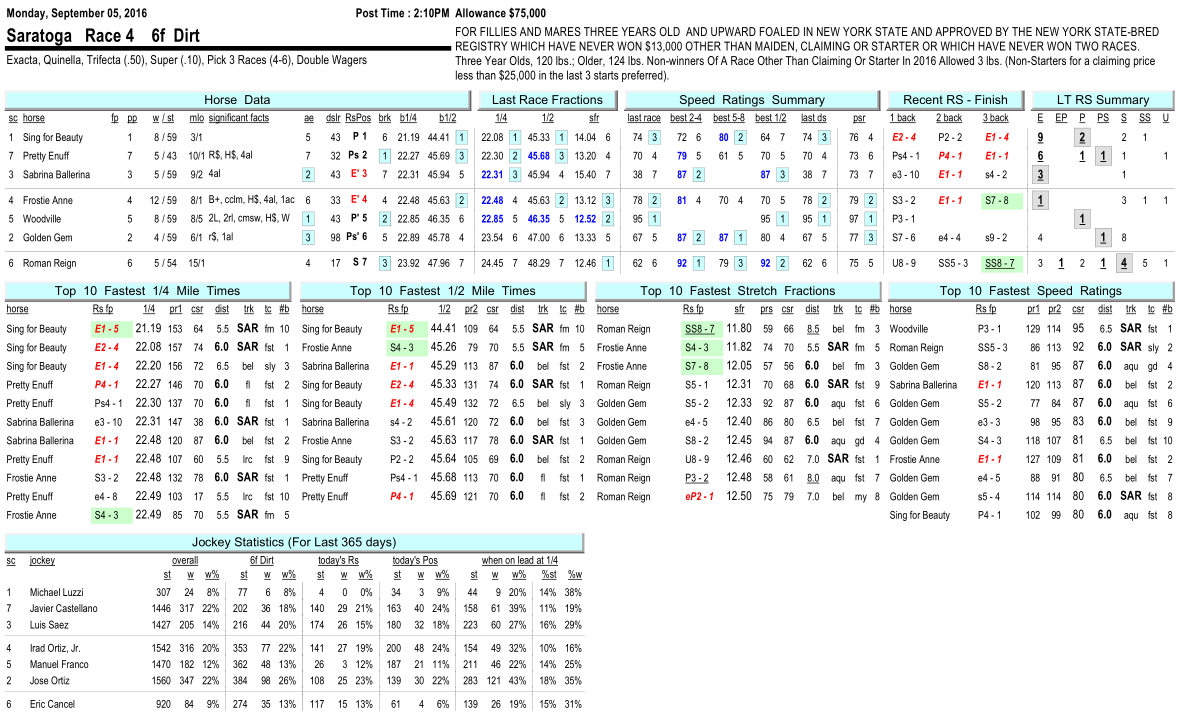
SECTIONS OF THE SUMMARY SHEET
- Race Header
- Horse Data
- Last Race Fractions
- Speed Ratings Summary
- Recent Rs-Finish
- LT RS Summary
- Top 10 Fastest 1/4 Mile Times
- Top 10 Fastest 1/2 Mile Times
- Top 10 Fastest Stretch Mile Times
- Top 10 Fastest Cramer Speed Ratings
- Jockey Statistics (Last 365 Days)
Note - except where otherwise stated, all statistical information is derived from the horse's last 10 races.
Race Header

This contains the race, date, track, race number, distance, surface, race type and purse, race conditions, and all available wagering options.
Horse Data
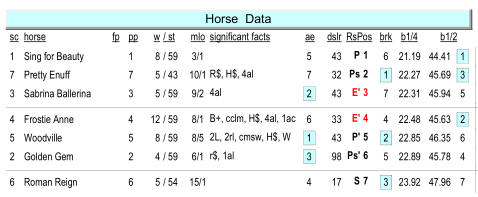
This section contains pertinent information on all of the horses entered today. From left to right - saddle cloth number, horse name, post position, starts/wins from this post position at this track at this distance and surface for the last 365 days, morning line odds, important facts (more on these later), lifetime average earnings (ranked), days since last race, RsPos TM. Items in red indicate early horses, projected start position (at the break), best raw 1/4 mile time, 1/2 mile time (adjusted for beaten lengths) that the horse received when he ran his best 1/4 mile time.
Last Race Fractions
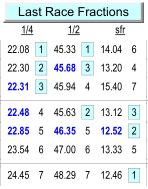
These times and rankings are all taken from the horse's last race and have been adjusted for beaten lengths so they reflect the horse's actual time, not the horse on the lead's time. The first column is the horse's last race 1/4 mile time and the ranking of this time within today's field. The next column is the horse's last race 1/2 mile time and rank within the field. The last column shows the horse's last race stretch fraction time (final furlong) and ranking.
Speed Ratings Summary
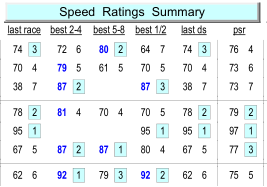
Here we show a summary of the Speed Ratings for the last 10 races. The first column separates out the horse's last race Speed Rating. We separate the last race from all other races because HDW's highest last race Speed Rating is the most predictive single piece of information from a horse's past performances available today! The next column shows the best Speed Rating the horse received in his 2nd through 4th races back. Next to that is the best Speed Rating he received in his 5th to 8th races back. The column titled "Best 1/2" shows the speed rating the horse received in the race where he ran his fastest first 1/2 mile. Last, and most important, is HDW's PSR (Projected Speed Rating) for today's race. The top three ranked PSR horses must be considered as potential winners of today's race!
Recent Rs - Finish
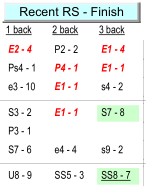
This section shows the horse's last three races, his Running Style and Position for the race, and his finish position. Items in red signify early horses (who were close to the lead at the 1/4). Items in green signify turf races. Underlines indicate route races.
LT RS Summary
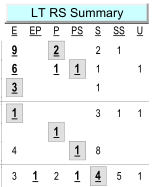
The Lifetime Running Style Summary Section shows the number of times the horse has run each Running Style, and whether or not he has won using each runnning style. The numbers in bold face and underlined indicate that the horse has won at this Running Style. The boxes around the numbers indicate the horse's projected Running Style for today's race.
Top 10 Fastest 1/4 Mile Times
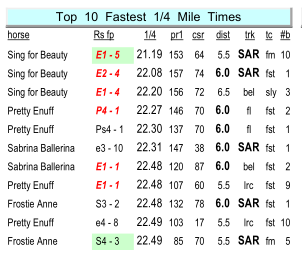
A list of the ten fastest 1/4 miles from the last 10 races for each horse. We show the horse's name, his Running Style and finish position for that race, his 1/4 mile time, our Pace Rating for the 1/4 mile, the Speed Rating for this horse in the race, the distance, track condition, track, and how many races back this particular race was.
Top 10 Fastest 1/2 Mile Times
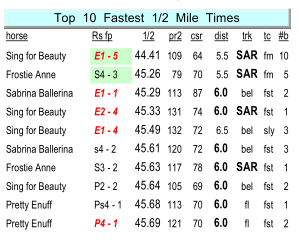
A list of the ten fastest 1/2 miles from the last 10 races for each horse. We show the horse's name, his Running Style and finish position for that race, his 1/2 mile time, our Pace Rating for the 1/2 mile, the Speed Rating for this horse in the race, the distance, track condition, track, and how many races back this particular race was.
Top 10 Fastest Stretch Fractions
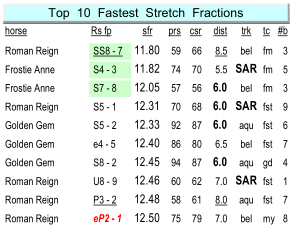
A list of the ten fastest stretch fractions from the last 10 races for each horse. We show the horse's name, his Running Style and finish position for that race, his stretch fraction time, our Pace Rating from the start to the top of the stretch, the Speed Rating for this horse in the race, the distance, track condition, track and how many races back this particular race was.
Top 10 Fastest Cramer Speed Ratings
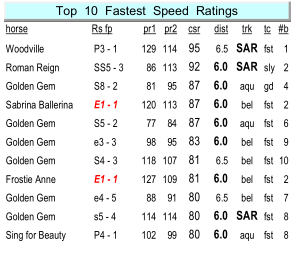
A list of the ten fastest Cramer Speed Ratings (CSR) from the last 10 races for each horse. We show the horse's name, his Running Style and finish position for that race, the Speed Rating for this horse in the race as well as this horse's times for the quarter and half, the distance, track condition, track, and how many races back this particular race was.
Jockey Statistics (For Last 365 Days)
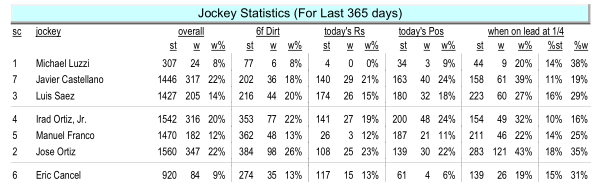
Here we present some pertinent information on each jockey in the races and how they do with horses who have today's running style. First is the saddle cloth number of the horse followed by the jockey's name. Then we show overall statistics for the last 365 days for this jockey - starts, wins, and win %. The next column shows how the jockey has performed with horses whose Running Styles match the projected Running Style of his horse today. Next is the jockey's statistics when on a horse with today's projected position. "When On Lead at 1/4" shows starts, wins and win % for this jockey when he manages to get the lead at the first 1/4 mile. The last two columns represent the % of starts that this jockey manages to get the lead at the first 1/4 pole, and what percentage of his wins occurred when he was on the lead at the first 1/4 mile. This information can be extremely helful when you are trying to determine who will get the early lead in a race, as much of it can depend upon the horse's post position and how the jockey will most likely ride the horse today. It also helps you decide whether today's jockey, if he does get the early lead, is capable of maintaining that lead for the duration of the race. If a jockey's name is in bold face it means that he rode the horse last out. Otherwise, it is a 'jockey switch.'
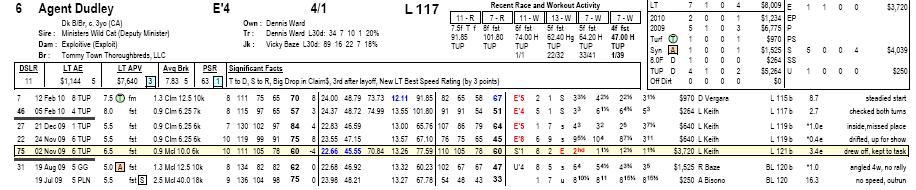
How To Read Past Performances
How To Read -Paceline Report (PP's) TM
The RsPos TM Paceline Report is indispensable if you are used to looking at past performances. Our past performances, however, also include some special features not found in any other past performance reports. We will go through each section and explain what information you can find there and what it means. Below is a sample of one horse's past performance. We will describe in detail all the different parts of this valuable report.

Sections of the Paceline Report
Here are the different sections of the Paceline Report:
- Horse Information
- Workout Information
- Lifetime Statistics
- Past Performance Lines
- Pace Ratings and Fractional Times
- Running Lines and Comments
Horse Information
This section contains the basic horse information. First is the post position followed by the horse's name. Under the name is the color, sex, age and state where the horse was bred. Next are the owner, breeder, sire (and sire's sire), dam (and dam's sire). To the right of the horse name is the Running Style-Position (PS10) and morning line odds. Below that is the trainer and jockey with their last 30 day statistics - starts, win, place, show, win%. The last line contains days since last race (DSLR), Medication (L for Salix), Equipment, Average Earnings (AE), and rank in this field. Average Purse Value (APV and rank in this field), and our Significant Facts. A complete list of Significant Facts is included in a separate document.
Workout Information

This section lists the horse's last 6 races and workouts in chronological order. The first number is the number of days ago and the letter represents a race or a workout. 7 - W means 7 days prior the horse worked 5f on a fast track in 64.20 seconds handily at Turf Paradise and was the 33rd fastest of 41 workouts that day.
Lifetime Statistics

These are the lifetime statistics for this horse in many different categories. First are lifetime starts, win, place, show, and earnings. Then we show current year and last year. After that we show separate statistics for turf races, races at today's distance, at today's track and on "off" tracks. On the right side of the box we show statistics for each different running style that the horse has displayed in his history.
Past Performance Lines

While most of the past performance information should look familiar, there are some different items in the RsPos TM past performances. We start on the far left side of the pp's with date of the race, number of days since that race, race number, track, distance, and track condition. The next number you see, 1.3 in the first past performance, is the ratio of today's race purse to this race purse. For example, if the purse of today's race is $13,000 then the purse on 12 Feb would be $10,000. So the horse is racing for a purse today that is 1.3 times the purse of his race on 12 Feb. Next is the race type or race name if it was a stake race, followed by the claiming price (where applicable) and purse in thousands. The last number in this group is the number of starters in that race.
Pace Ratings and Fractional Times

This section contains pace ratings for the race and for this horse in that race along with this horse's fractional times. The first set of four numbers are pace and speed ratings for the horse on the lead in that particular race. First is the pace rating to the first 1/4 mile, then the pace rating to the 1/2 mile, then the pace rating to the top of the stretch. The last number in bold is the final Cramer Speed Rating for the winner of the race.
The fractional times in the middle represent the horse's actual time adjusted for beaten lengths. First is the 1/4 mile time, then 1/2 mile time, then the 3/4 mile time, then the stretch fraction (the final 1/8 of a mile) and finally the final time. All times are in seconds.
The last group of numbers are this horse's pace ratings for this race, using the same distances as the previous set of pace ratings. The last figure in bold is the Cramer Speed Rating that this horse earned in the race. Items in blue are the top figures for that particular category.
Running Lines and Comments

The last section contains the projected Running Style-Position for that race, the post position of the horse, his position at the break, his actual Running style for the race, and the position and beaten lengths at each point of call (1/4 mile, 1/2 mile, stretch call, and finish). Next comes the jockey (if it is in bold it is today's jockey) followed by medication and equipment indicators, final odds, and the chart caller's comments.
How To Read Encapsulated Past Performances
RsPos TM Encapsulated PP's
The RsPos TM Encapsulated PP Report was created for those who want a little more information about the horse's last 10 races than show on the Summary Report, yet compact enough to fit one race on a page. We achieved this goal with this report.
Race Header

This contains the race date, track, race number, distance, surface, race type and purse, race conditions, and all available wagering options.
Horse Data

This section contains information about the horse, trainer, and jockey. First is the saddle cloth number, post position, horse name, morning line odds, days since last race (DSLR), Projected RsPos TM for today's race, the horse's best raw 1/4 mile time and the 1/2 mile time in that race. The last number on this line is the projected position of this horse at the "start" or "break" call in today's race based upon his past performances at the "start" or "break" call.
Next is the jockey and his last 365 days starts, win, place, show, and win %. Below that is the same information for the trainer. Next come the horse's starts, win, place and show for either routes or sprints, for this distance, and at this track. At the bottom are any Significant Facts for this horse and his Average Earnings per start along with his rank within this field.
Fractional Time and Speed Rating Rankings

This box shows how the horse's last race fractional times to the 1/4, to the 1/2, and for the stretch fraction (or final 1/8) rank compared to all other horses in the race. A "1" ranking indicates that this horse ran the fastest time in its last race of all the other horses in today's race. Next to the times are rankings of Cramer Speed Ratings for the horse's last race, the best CSR from his 2nd to 4th races back, the best CSR from his 5th to 8th races back, the best CSR for the last 3 races at today's exact distance/surface (xd). The last column, b1/4, is this horse's rank for the CSR he earned in the race where he ran his fastest opening 1/4 mile.
Past Performances

The remaining portion of this report shows each of the horse's last 10 races in a summarized fashion. The CSR (Cramer Speed Rating) is shown at the top, and the best CSR is highlighted in blue. Below that is the horse's Running Style and finish position in that race, with "early" styles highlighted in red. Next are the horse's fractional times for the 1/4 mile and 1/2 mile, adjusted for beaten lengths. The next number is the horse's time for the final 1/8 mile. Again, the best times are highlighted in blue. At the bottom is the race distance, track, track condition, race type, claiming price (where applicable) and purse in thousands.
How To Read Trainer/Jockey/Pedigree Report
RsPos TM Trainer/Jockey/Pedigree Report
The Trainer/Jockey/Pedigree Report contains a wide variety of statistics, some of which will change from horse to horse depending on the conditions of today's race. For instance, if the horse is wearing blinkers for the first time we will show statistics on how the trainer does when first adding blinkers. If the race is a sprint and the horse last ran in a route race, we will show statistics on how the trainer does when moving his horses from sprint to route. Other examples include first and second after a layoff, purse drops and rises, turf to dirt, and dirt to turf.
Race Header

This contains the race date, track, race number, distance, surface, race type and purse, race conditions, and all available wagering options.
Horse-Trainer-Jockey Statistics

These statistics are derived from the last 365 days. The first section on the left is the horse's saddle cloth number, trainer, and jockey names. Next to that are general statistics for the trainer which will vary depending on the horse and race. This example shows the trainer's starts, wins, win %, and ROI (to 1.00) for Dirt Routes, Claiming races, with 4 year olds and up, and at today's track (TUP). Next is the trainer-jockey combination overall and on dirt. Then comes the trainer's record with favorites and with horses at odds > 10-1. The last section contains statistics that are pertinent to this horse in today's race. If the horse has front wraps on today, for instance, we know that the trainer wins 0% with FWp ON. This horse is making his second start after a layoff and we see the trainer hits at 0% in this category.
Pedigree Statistics

The last portion of the report contains pedigree statistics (starts, wins, and win %) for the Sire's progeny, the Dam Sire's grand-progeny, and the Dam's progeny. These statistics are calculated from the last 5 years plus the current year.
Significant Facts Codes Reference
Codes Used by HDW for Significant Facts
Miscellaneous Codes
| Code | Description |
|---|---|
| 1r | First time route race (8 furlongs or longer) |
| 1t | First time in a turf race |
| sr | Sprint to Route (last race was a sprint, current race is a route) |
| rs | Route to Sprint (last race was a route, current race is a sprint) |
| dt | Dirt to Turf (last race was on the dirt, current race is on the turf) |
| td | Turf to Dirt (last race was on the turf, current race is on the dirt) |
| 2rl | Second race lifetime (horse has only raced once previously) |
| 3rl | Third race lifetime (horse has raced twice previously) |
| 1L | First time using Salix (Lasix) |
| 2L | Second time using Salix (Lasix) |
| B+ | Blinkers on (horse is adding blinkers, did not wear blinkers in last race) |
| B- | Blinkers off (horse is removing blinkers, did wear blinkers in last race) |
| 1al | First race after a layoff of 45 or more days |
| 2al | Second race after a layoff of 45 or more days |
| 3al | Third race after a layoff of 45 or more days |
| 4al | Fourth race after a layoff of 45 or more days |
| 1ac | First race after being claimed |
| 2ac | Second race after being claimed |
| 3ac | Third race after being claimed |
| 4ac | Fourth race after being claimed |
| W | Big win last race (horse won by 5 or more lengths) |
| dW |
Duelling win - horse won last race duelling with the second place horse (they finished within 1 length apart) and the third place finisher was 5 or more lengths behind the place horse. In other words, two duelling horses pulled away by 5 or more lengths from the rest of the pack and this horse won. |
| dP | Duelling place - horse placed in the last race duelling with the win horse (they finished within 1 length apart) and the third place finisher was 5 or more lengths behind the place horse. In other words, two duelling horses pulled away by 5 or more lengths from the rest of the pack and this horse finished second. Surprisingly, these horses come back to win 24% or more (depending on how far they pulled away from the rest of the pack) of their next races. |
| LC$ | Lowest claiming price ever |
| L$ | Lowest purse ever |
| H$ | Highest purse ever |
| LRI | Lightly raced and improving - has fewer than 10 starts and speed ratings in its last 3 races have steadily improved |
| NT(x) | Last race speed rating was a new high speed rating for this horse by x points. For instance NT(6) means in the last race, the horse ran a speed rating 6 points higher than it had ever run. |
Class Changes for Claiming Races (including Claiming Stakes and Claiming Handicaps)
| Code | Description |
|---|---|
| DC$ | Large drop in claiming price - 40% or more, example: $25,000 to $16,000 |
| dc$ | Small drop in claiming price - 20% - 39%, example: $12,500 to $10,000 |
| RC$ | Large rise in claiming price - 50% or more, example: $16,000 to $25,000 |
| rc$ | Small rise in claiming price - 25% - 49%, example: $10,000 to $12,500 |
| cmcl | Coming from a maiden claiming race |
| cmws | Coming from a maiden special weight |
| DSTR | Dropping from a starter handicap or allowance with a 40% or more drop in purse |
| dstr | Dropping from a starter handicap or allowance with a 20% to 39% drop in purse |
| cstr | Coming from a starter handicap or allowance (everything else) |
| DOCL | Dropping from an optional claiming race with a 40% or more drop in purse |
| docl | Dropping from an optional claiming race with a 20% to 39% drop in purse |
| cocl | Coming from an optional claiming race (everything else) |
| DALW | Dropping from an allowance race with a 40% or more drop in purse |
| dalw | Dropping from an allowance race with a 20% to 39% drop in purse |
| calw | Coming from an allowance race (everything else) |
| DHCP | Dropping from a handicap race with a 40% or more drop in purse |
| dhcp | Dropping from a handicap race with a 20% to 39% drop in purse |
| chcp | Coming from a handicap race (everything else) |
| DSTK | Dropping from a non-graded stakes race with a 40% or more drop in purse |
| dstk | Dropping from a non-graded stakes race with a 20% to 39% drop in purse |
| cstk | Dropping from a non-graded stakes race (everything else) |
| DG1 | Dropping from Grade 1 Stakes |
| DG2 | Dropping from Grade 2 Stakes |
| DG3 | Dropping from Grade 3 Stakes |
Class Changes for Maiden Claiming (MCL) Races
| Code | Description |
|---|---|
| DC$ | Large drop in claiming price - 40% or more, example: $25,000 to $16,000 |
| dc$ | Small drop in claiming price - 20% - 39%, example: $12,500 to $10,000 |
| RC$ | Large rise in claiming price - 50% or more, example: $16,000 to $25,000 |
| rc$ | Small rise in claiming price - 25% - 49%, example: $10,000 to $12,500 |
| dmsw | Dropping from maiden special weight |
| dnmd | Dropping from non-maiden race (e.g. claiming or allowance) |
Class Changes for Maiden Special Weight (MSW) Races
| Code | Description |
|---|---|
| rmcl | Rising from maiden claiming |
| dnmd | Dropping from allowance, handicap or stakes |
| cnmd | Coming from claiming or starter allowance/handicap |
Class Changes for Starter Allowance/Handicap (ALW/HCP) Races
| Code | Description |
|---|---|
| cmsw | Coming from a maiden special weight |
| cmcl | Coming from maiden claiming race |
| DHCP | Dropping from a handicap race with a 40% or more drop in purse |
| dhcp | Dropping from a handicap race with a 20% to 39% drop in purse |
| chcp | Coming from a handicap race (everything else) |
| DSTK | Dropping from a non-graded stakes race with a 40% or more drop in purse |
| dstk | Dropping from a non-graded stakes race with a 20% to 39% drop in purse |
| cstk | Coming from a non-graded stakes race (everything else) |
| DG1 | Dropping from a Grade 1 Stakes |
| DG2 | Dropping from a Grade 2 Stakes |
| DG3 | Dropping from a Grade 3 Stakes |
| D$ | Large drop in purse (40% or more) |
| d$ | Small drop in purse (20% to 39%) |
| R$ | Large rise in purse (40% or more) |
| r$ | Small rise in purse (20% to 39%) |
Class Changes for Allowance (ALW) Races
| Code | Description |
|---|---|
| cmsw | Coming from maiden special weight |
| cmcl | Coming from a maiden claiming race |
| cclm | Coming from a claiming race |
| DHCP | Dropping from a handicap race with a 40% or more drop in purse |
| dhcp | Dropping from a handicap race with a 20% to 39% drop in purse |
| chcp | Coming from a handicap race (everything else) |
| DSTK | Dropping from a non-graded stakes race with a 40% or more drop in purse |
| dstk | Dropping from a non-graded stakes race with a 20% to 39% drop in purse |
| cstk | Coming from a non-graded stakes race (everything else) |
| DG1 | Dropping from a Grade 1 Stakes |
| DG2 | Dropping from a Grade 2 Stakes |
| DG3 | Dropping from a Grade 3 Stakes |
| D$ | Large drop in purse (40% or more) |
| d$ | Small drop in purse (20% to 39%) |
| R$ | Large rise in purse (40% or more) |
| r$ | Small rise in purse (20% to 39%) |
Class Changes for Stakes/Handicap (STK/HCP) Races
| Code | Description |
|---|---|
| rg2 | Rising from Grade 2 |
| rg3 | Rising from Grade 3 |
| rng | Rising from non-graded stakes |
| rhcp | Rising from handicap |
| dg1 | Dropping from Grade 1 Stakes |
| dg2 | Dropping from Grade 2 Stakes |
| dg3 | Dropping from Grade 3 Stakes |
| cclm | Coming from claiming race |
| cocl | Coming from optional claiming race |
| cstr | Coming from starter handicap race |
| calw | Coming from an allowance race |
| cmsw | Coming from maiden special weight |
| cmcl | Coming from maiden claiming race |
About Pace Ratings
Pace Ratings
Pace ratings for the 1/4 mile, 1/2 mile, and stretch are calculated for each past performance line. Using the track to track adjustments and the track variant, a final time speed rating is calculated assuming that the horse would run the entire race at the same velocity as the horse's average velocity in the fractional part of the race. For example, assuming a horse ran the first 1/4 mile of a 6 furlong race in 22 seconds, then the average velocity for this 1/4 mile is 60 feet per second. If the horse ran the entire race at a rate of 60 ft/sec, the time for 6 furlongs would be a new world record of 1:06. If this race was run at Santa Anita, the speed rating for that effort would be 176. This same method is used to calculate pace ratings for each part of the race. The advantage of scaling the pace rating in this manner is that it makes it easier to visualize how fast a horse is running in the earlier parts of the race.
To illustrate let's compare three route races of Skip Away and Silver Charm.
| HORSE | 1/4 | 1/2 | STRETCH | FINAL |
|---|---|---|---|---|
| Skip Away | 160 | 141 | 123 | 119 |
| Skip Away | 143 | 144 | 120 | 118 |
| Skip Away | 138 | 129 | 119 | 118 |
| Silver Charm | 90 | 101 | 111 | 116 |
| Silver Charm | 120 | 133 | 118 | 115 |
| Silver Charm | 127 | 131 | 117 | 114 |
Comparing only final time speed ratings, one might conclude that these horses are pretty closely matched, but the pace ratings would indicate that they may not be very close at all. It appears that if Silver Charm tries to match pace with Skip Away at a 150+ early pace, he might have trouble breaking 100 for a final speed rating. The faster Silver Charm goes in the early part of the race, the slower his final time. Our objective here is to provide an accurate, understandable pace rating that helps the horse player understand the race.